
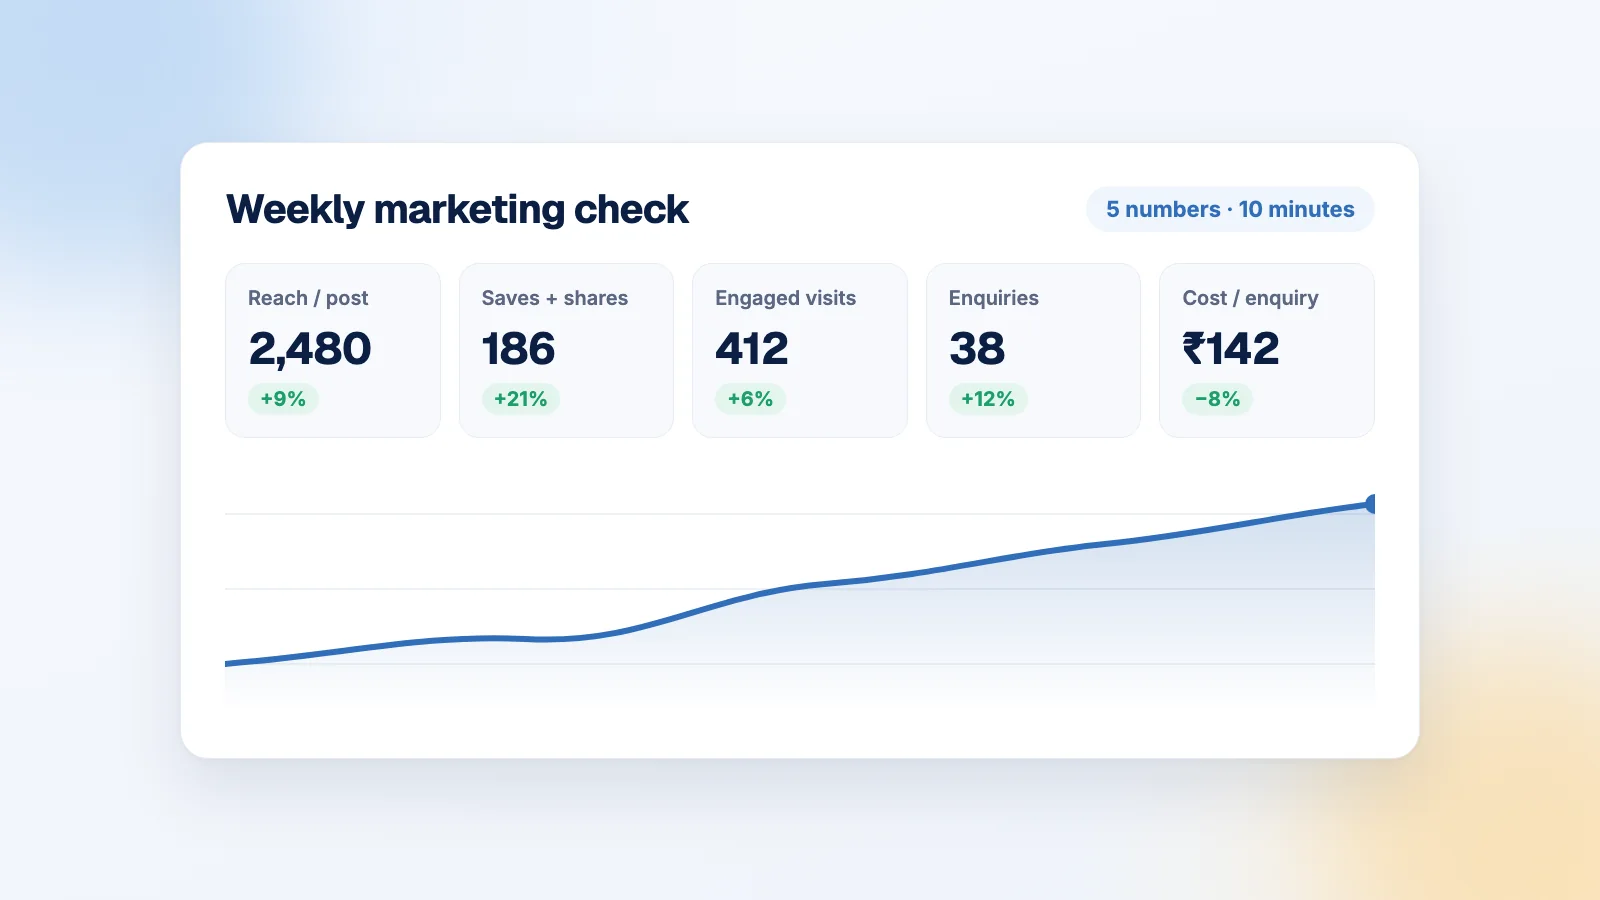
Open Instagram Insights, Meta Business Suite and Google Analytics side by side and you’ll see well over a hundred numbers. A small team has time to act on maybe five.
These are the five we’d pick, and a few popular ones we’d happily ignore.
1. Reach per post
How many different people saw each post, on average.
This is the first number that moves when you change what you post, which format you use, or how often you post. If it’s rising, the platform likes what you’re doing.
Compare it month to month on the same platform. Instagram reach and LinkedIn reach are different audiences, so comparing them tells you nothing.
2. Saves, shares and replies
Anyone can double-tap a post while scrolling past. Saving it means “this is useful, I’ll come back”. Sharing means “someone else needs to see this”. Replying means you’ve started a conversation, and conversations are where sales happen.
That’s also why carousels do so well: people save them.
Each month, list your top five posts by saves plus shares. That short list is the best content brief you’ll ever get.
3. Engaged visits to your website
Clicks from social media include plenty of people who bounce in two seconds. So look at engaged visits instead.
In Google Analytics 4, a session counts as engaged if it lasted longer than 10 seconds, triggered a key event (a form submission, say), or included at least two page or screen views (Google Analytics Help).
To know which post or campaign sent those visits, add UTM tags to every link you share. You always need three: utm_source (where it came from, like instagram), utm_medium (the type of channel, like social) and utm_campaign (which push it was, like diwali_giftboxes) (Google Analytics Help). A tagged link looks like this:
https://yourshop.in/gift-boxes?utm_source=instagram&utm_medium=social&utm_campaign=diwali_giftboxes
Ugly, yes. But it’s the difference between “Instagram sends us traffic, I think” and actually knowing.
4. Enquiries
This is the number closest to money that marketing directly controls: a form filled in, a call, a booking, a “pls send price” on WhatsApp.
That last one matters a lot in India. For many small businesses, most enquiries never touch the website at all. They arrive as WhatsApp messages. So count those too. The WhatsApp Business app lets you label chats; add a label for where each enquiry came from (Instagram, Google, Referral) and count them at the end of the week. On your website, mark form submissions and WhatsApp-button clicks as key events in GA4.
5. Cost per enquiry (only if you run ads)
Ad spend divided by the enquiries those ads brought in.
On its own this number means nothing; it only makes sense next to what an enquiry is worth to you. If one in four enquiries becomes a ₹2,000 order, each enquiry is worth about ₹500, and paying ₹150 for one is a good deal. Paying ₹700 is not.
Track it per campaign, every week. But before you change anything, read our small-budget Meta ads playbook. Fiddling with ads every day usually makes this number worse, not better.
What we’d happily ignore
Follower count. It’s nice to see it go up, but it tells you little about sales. If you want a follower number, use the growth rate (new followers divided by what you started with) and treat it as a side metric.
Likes on their own. They’re the lowest-effort signal there is. Saves, shares and replies tell you more.
Total impressions. The same small group seeing a post five times inflates this. Reach is the more honest number.
Industry benchmarks as targets. Average engagement on Instagram fell about 24% year on year in 2026 (Socialinsider). Chasing somebody else’s average is a losing game. Your own trend line is the one to beat.
The Monday dashboard
Copy this into a Google Sheet and give it ten minutes every Monday morning:
| Metric | This week | Last week | Change | Why? |
|---|---|---|---|---|
| Average reach per post (Instagram) | ||||
| Saves + shares (all posts) | ||||
| Engaged sessions from social (GA4) | ||||
| Enquiries (website + WhatsApp + calls) | ||||
| Cost per enquiry (ads only) |
The “Why?” column is the most useful part, strangely enough. Write down what you think moved each number: “packing Reel did really well”, “no posts during the wedding rush”, “paused ads Thursday”. After two months those notes become your own playbook, based on your customers rather than anyone’s blog post, including this one.
Sources
- Google Analytics Help, “[GA4] Engagement rate and bounce rate”
- Google Analytics Help, “URL builders: Collect campaign data with custom URLs”
- Socialinsider, “2026 Instagram Organic Engagement Benchmarks”
We checked every figure in this article against the original source on 25 September 2026.